
Aroma Project
Hello Friends, I’ve decided to post materials from our recent paper published at http://www.jopan.org/article/S1089-9472(16)30334-3/fulltext. This combination manuscript, code, and other materials comprise an ‘RMarkdown’ document (check the code oout), in which all elements of the project are in one central ‘.Rmd’ document. I actually did this project while in Afghanistan and Iraq last year. Having the text, bibliography, raw data, code, and everything integrated into one document provides an unprecedented way to track and manage the project, especially when you’re doing it in between war zones! I simply click a knit button in RStudio, and it compiles the whole document into what you see below. As for the content of the paper, I worked with a wonderful group of nurses at Deaconess Hospital, IN and the Unviersity of Southern Indiana on this project. I stuck to a very simple task- to identify the most important predictors of post operative nausea and vomitting (PONV). In our limited dataset, we show the top predictors of PONV. As with every project, I always find things that wish I could have done better! Here, I would have been more cautious with parallel processing in machine learning to avoid results that are essentially not reproducible. Although we show the best case scenario for AUC ~ 0.69, we have continued to collect more data and have many more cases now that are being used to build an even better model that we will describe mathematically in the next paper. With the much larger datset, we are achieving AUC scores of 0.83 - 0.85. We look forward to building a predictive model into the Electronic Health record to notify health care providers of patients at risk for PONV in order to improve care and reduce length of stay. Once we finish the full project, I’ll post the full dataset and other materials. See the RMarkdown dowcument below, until next time…
Title
A Comparison of Aromatherapy to Standard Care for Relief of PONV and PDNV in Ambulatory Surgical Patients
Abstract
Purpose: To determine effectiveness of aromatherapy (AT) compared with standard care (SC) for postoperative and postdischarge nausea and vomiting (PONV/PDNV) in ambulatory surgical patients.
Design: Prospective randomized study.
Methods: Patients \((n = 254)\) received either SC or AT for PONV and interviewed for effectiveness of PDNV. Machine learning methods (eight algorithms) were used to evaluate.
Finding: Of patients (64 of 221) that experienced PONV, 52% were in the AT group and 48% in the SC group. The majority were satisfied with treatment (timely, \(P=.60\); effectiveness, \(P=.86\). Of patients that experienced PDNV, treatment was 100% effective in the AT group and 67% in the SC group. The cforest algorithm was used to develop a model for predicting PONV with literature-based risk factors (0.69 area under the curve).
Conclusions: AT is an effective way to manage PONV/PDNV. Gender and age were the most important predictors of PONV.
Keywords: aromatherapy, postoperative and postdischarge nausea and vomiting (PONV/PDNV), ambulatory surgical patients, comfort theory.
Introduction
POSTOPERATIVE NAUSEA AND VOMITING (PONV) is an unpleasant side effect of anesthesia and a long-standing concern of health care providers and patients since the late 1840s.1 Nausea is an inadvertent complication of anesthesia that occurs in 30% of patients and up to 70% to 80% of patients with high-risk factors up to 24 hours after ambulatory surgery.2 The rate of postdischarge nausea and vomiting (PDNV) is as high as 37%.3 While pharmacological intervention reduces the risk of PONV by 12% to 26%,4 there is no treatment available that totally eliminates this risk.5 PONV potentiates delayed discharges and unanticipated hospital admissions, increases medication charges, is extremely discomforting, and has the potential of secondary clinical complications.7 Thus, PONV adversely affects patient satisfaction, clinical outcomes, and health care costs.
At a Midwestern hospital, routine practice for staff nurses in the postanesthesia care unit (PACU) included use of an isopropyl alcohol swab vapor to deter PONV. The practice of using isopropyl alcohol swab vapor can cause the patient to abruptly withdraw from the vapor and have a negative experience in care. Staff nurses were introduced to an aromatherapy (AT) product and, similar to waving an alcohol swab, the patient inhaled the four-essential oil mixture that blends to produce a pleasant aroma. After nurses experienced success in alleviating PONV in postsurgical patients with AT, the clinical question was raised: How effective is AT in relieving PONV compared to standard care (SC) in postsurgical patients?
Literature Review
In 2014, an inductive search of the literature found insufficient evidence to determine efficacy of AT as an agent to reduce postoperative and postdischarge nausea and vomiting (PONV/PDNV) as there were numerous studies with a large degree of heterogeneity between products, doses, patient population, and types of surgeries. The 2006 American Society of PeriAnesthesia Nurses (ASPAN) Evidence-Based Clinical Practice Guidelines for the prevention and/or management of nausea and vomiting recommended higher quality research on the effect of various complementary modalities on the reduction of PONV and recommended the efficacy of AT as a rescue agent be evaluated.9 A Cochrane review of AT, which included randomized controlled trials and controlled clinical trials up to August 2011, concluded that there was no reliable evidence for effective relief of PONV.10 In addition, they concluded that isopropyl alcohol, which is often used as a means to deter PONV, was not effective in reducing PONV in most patients, thus requiring administration of rescue antiemetics.
Since 2014, one randomized study comparing the effectiveness of a four-essential oil AT by a handheld inhaler to an unscented inhaler demonstrated that AT significantly reduced nausea and found that perceived effectiveness of ATwas significantly higher in the treatment group \((P<.001)\).11 While limited evidence suggests AT reduces PONV, no evidence shows it is harmful and it has been associated with high patient satisfaction.10 Furthermore, AT is a complementary adjunct that can be initiated without a physician order. Thus, it necessitates prescreening for potential risk factors to prepare for PONV.
Standard risk factors associated with prevention and management of PONV are identified throughout the literature. ASPAN guidelines and the Society for Ambulatory Anesthesia consensus guidelines graded levels of evidence that support risk factors for PONV.9 Risk factors include female gender, histories of PONV or motion sickness, use of postoperative opioids, volatile anesthetics, nitrous oxide, nonsmoker, age, duration and type of surgery, and body mass index (BMI). BMI as a risk factor for PONV, however, appears controversial by weak and/or conflicting research.12–14 Implications of identifying risk factors in the prevention and management of PONV, however, assist perianesthesia nurses in PONV reduction strategies.12
Theoretical Framework
The middle range theory of comfort by Kolcaba and Kolcaba16 supports the conceptual framework for this research study. Comfort theory is the condition of being strengthened when physical, mental, spiritual, and cultural needs are addressed.16 Patients entering the health care environment seek to have their needs met from a holistic view point and not simply from their diagnosis. These environments unfortunately may cause the patient to experience discomfort such as pain, nausea, and stress.17 Application of the comfort concept is relevant to the perianesthesia environment inclusive of those providing the care. Comfort is a situation in which needs of relief, ease, and transcendence are provided.16 The role of the perianesthesia nurse includes the provision of a safe and comfortable environment to patients.17 Thus, the comfort theory is exemplified in the role of the perianesthesia nurse in assessment and management of PONV. For example, the nurse plays a critical role in risk factor assessment, communicating risks to all caregivers, and providing relief of PONV.12 Therefore, comfort interventions provided by compassionate and knowledgeable nurses with a holistic focus promote ease, relief, and transcendence.
Methods
Study Design
With approval of the internal research committee, Anesthesia Medical Department, and the University of Southern Indiana’s Institutional Review Board, the effectiveness of AT for relief of PONV/PDNV for ambulatory patients in a prospective randomized study was conducted at a 537-bed midwest multicampus teaching hospital. The study occurred on one campus of the hospital in the postanesthetic phases of care, which entailed the PACU and same day care center (SDCC). Inclusion criteria consisted of competent adult ambulatory surgical patients who were discharged to home from SDCC. Exclusion criteria consisted of age less than 18 years; decisional impairment; and known allergy to peppermint, spearmint, lavender, and/or ginger.
Study subjects were recruited from a convenience sample of ambulatory surgical patients who were expected to be discharged home that same day. The study recruited sufficient patients to allow it to have a high probability of detecting a clinically important difference between the intervention and control groups based on a power analysis, which generated an \(n=254\) to determine if a statistically significant difference exists between groups. Subsequently, 254 blue pocket folders labeled “Aromatherapy Study” were prepared before the start of the study with an outside sticker containing a sequential study ID number (ie, 1 thru 254) and an inside sticker labeled with the computer-generated randomized group assignment to the “SC” arm or the “AT” arm. Each folder contained an informed consent and a two-sided data collection sheet (DCS). The AT folders contained additional items such as a booklet about the AT product and the AT container (both provided by the AT vendor) and an information sheet that detailed usage of the AT product after discharge. The study folders were kept in numerical order in SDCC and distributed accordingly. The AT utilized was a commercially available (QueaseEASE, Newton, Alabama, USA) drug-free, all-natural product consisting of a unique blend of pure essential oils (spearmint [ Mentha spicata ], peppermint [ Mentha piperita ], ginger [ Zingiber officinale ], and lavender [ Lavandula angustifolia ]).
Procedure
During the preadmission interview, nurses used a preapproved script to inform patients about the study and asked if there were any known allergies to peppermint, spearmint, lavender, or ginger. Patients were told that they would receive more information about the study on registration in SDCC and may be given an opportunity to participate. On the day of the procedure, patients were handed a two-sided AT study informational form that provided an overview of the study with a copy of the informed consent on the back side.
Patients reviewed the information while waiting to be admitted and those who were interested then received further information from the admitting nurse. Once patients voluntarily agreed to participate, the nurse retrieved the next sequential folder to review the informed consent, obtain a written informed consent, and initiate the study DCS. The assigned folder accompanied the patient throughout the perioperative phases of care. On admission to PACU, the nurse identified which study group the patient was randomized to and filled in the information requested on the DCS for the intraoperative (IO) period. A baseline assessment was obtained on arrival to the postoperative area and subsequently on and after complaint of PONV. Based on nurses’ clinical interactions with patients who experienced PONV, the nausea scale used was a five-point Likert scale (0 to 4: none, not sure, mild nausea, moderate nausea, and severe nausea). Frank vomiting was considered a level 4 on the nausea scale. For patients with PONV, nausea was treated according to their assigned study group. For patients who experienced PONV in the SC group, treatment was defined as anesthesia provider–specific pharmacologic choices individualized to each patient. For patients in the AT group, treatment was administration of the AT; SC was not withheld if nausea was unrelieved. The number of antiemetic and analgesic doses administered and the total time spent in the respective area were recorded on the DCS. Use of AT was reinforced in the AT group, and the product was sent home with the patient. On discharge, a patient satisfaction survey was administered with a six-point Likert scale (0-5: strongly disagree, disagree, somewhat disagree, somewhat agree, agree, and strongly agree). The postoperative survey questions were scored on the same scale and were as follows:
1. The treatment I was given relieved my nausea in a timely manner.
2. The treatment I received controlled my nausea.
Patients who experienced PONV from both the control and intervention group were called postdischarge to determine the presence and effectiveness of treatment for PDNV. The postdischarge survey questions were:
1. Have you had nausea since leaving the hospital? If so, rate your nausea.
2. Since discharge, what did you do to relieve your nausea? Was it effective?
Statistical Analysis
Data were deidentified, and \(\chi^2\) tests and one-way analysis of variance tests were conducted in R using RStudio, open-source statistical analyses tools.19 Demographic tables and analyses were constructed with sjPlot.21 Graphs were constructed with gridExtra, ggplot2, and cowplot.22
Machine Learning
Machine learning methods were used to evaluate whether literature-based risk factors and/or other preoperative and IO variables predict PONV (see example workflow in Figure 1). The full data set was randomly divided into a training set (65%) and testing set (35%). Predictors (age, BMI, histories, etc.) were evaluated and preprocessed, and those that showed no variance were removed (preoperative nausea and anesthesia metrics). Data were scaled and centered; however, other transformations were also evaluated (data not shown). The caret package25 was used to implement models: C5.0, cforest, ctree, gbm, nnet, pls, rf, and rpart. Parameters were tuned within the train function ( \(n=5\) ), and three different resampling methods were selected (bootstraps, cross-fold and repeated cross-fold validation). The results of the training set were evaluated by receiver operator curves (ROCs) established during tuning and resampling. Parameters and sampling methods that maximized ROC were used to execute the predict function with the training set data. After an iterative process, the best model (ie, highest area under the curve [AUC] in five replicates) and the relative importance of variables/classifiers were reported.25 All work was performed with R Markdown with knitr to insure reproducible research standards.26–28
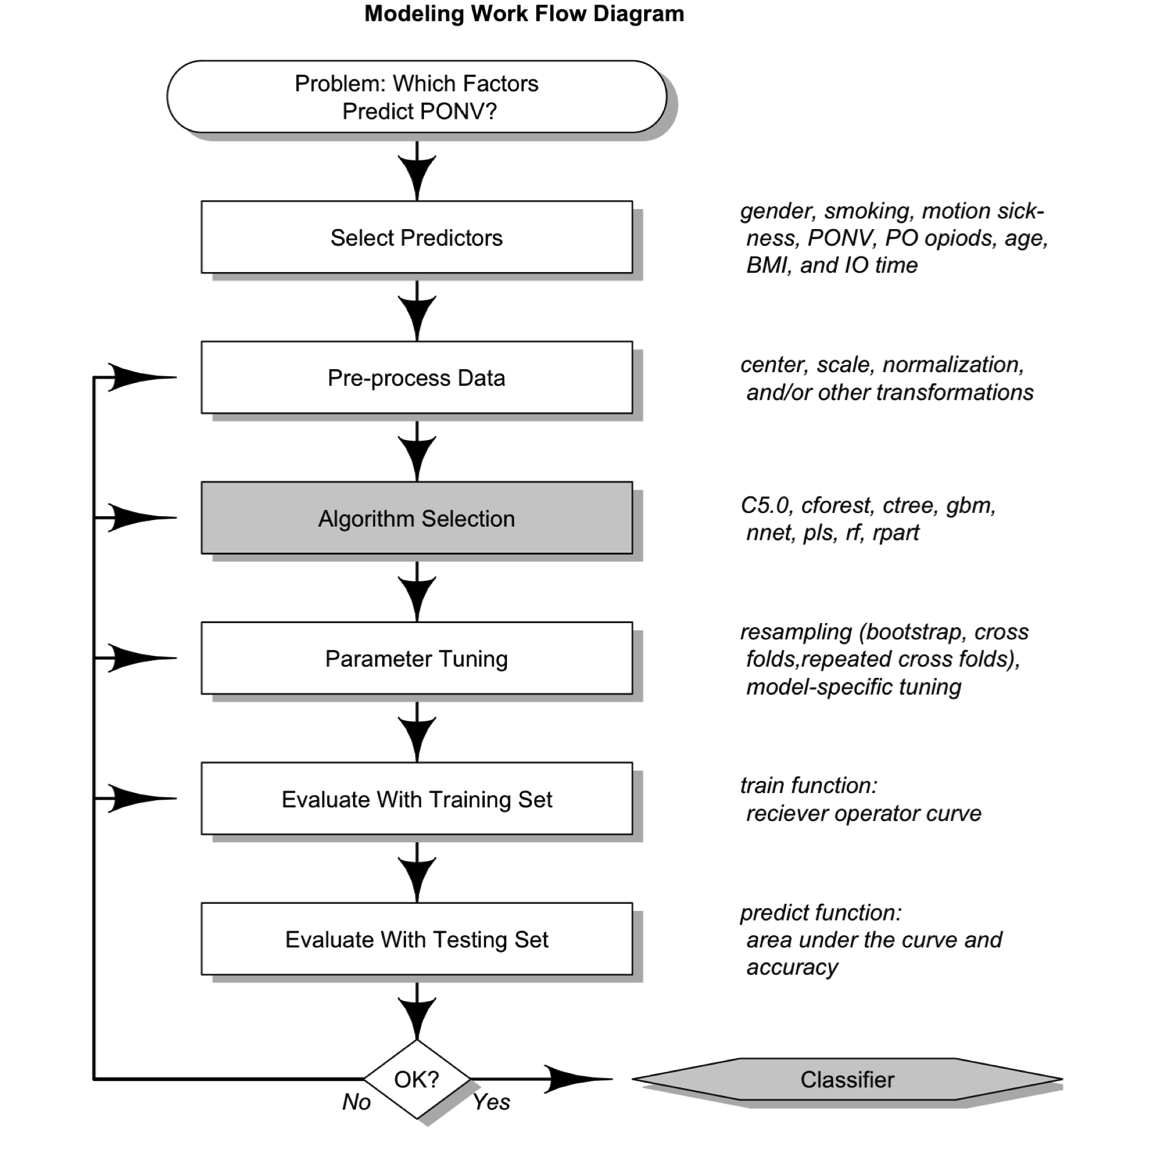
Figure 1. Machine learning workflow. PONV, postoperative nausea and vomiting; PO, postoperative; BMI, body mass index.
Results
Patient Demographics, Distribution of Surgeries, and Postoperative Length of Stay
Of 804 eligible patients, 254 were recruited; 33 were excluded due to admissions, voluntary withdrawal, or reporting errors. Thus, 221 patients were enrolled into either the SC ( \(n = 113\) or 51%) group or the AT ( \(n = 108\) or 49%) group in a random manner (Table 1).
Table 1. Patient Demographics (Categorical Data) Comparing SC to AT.
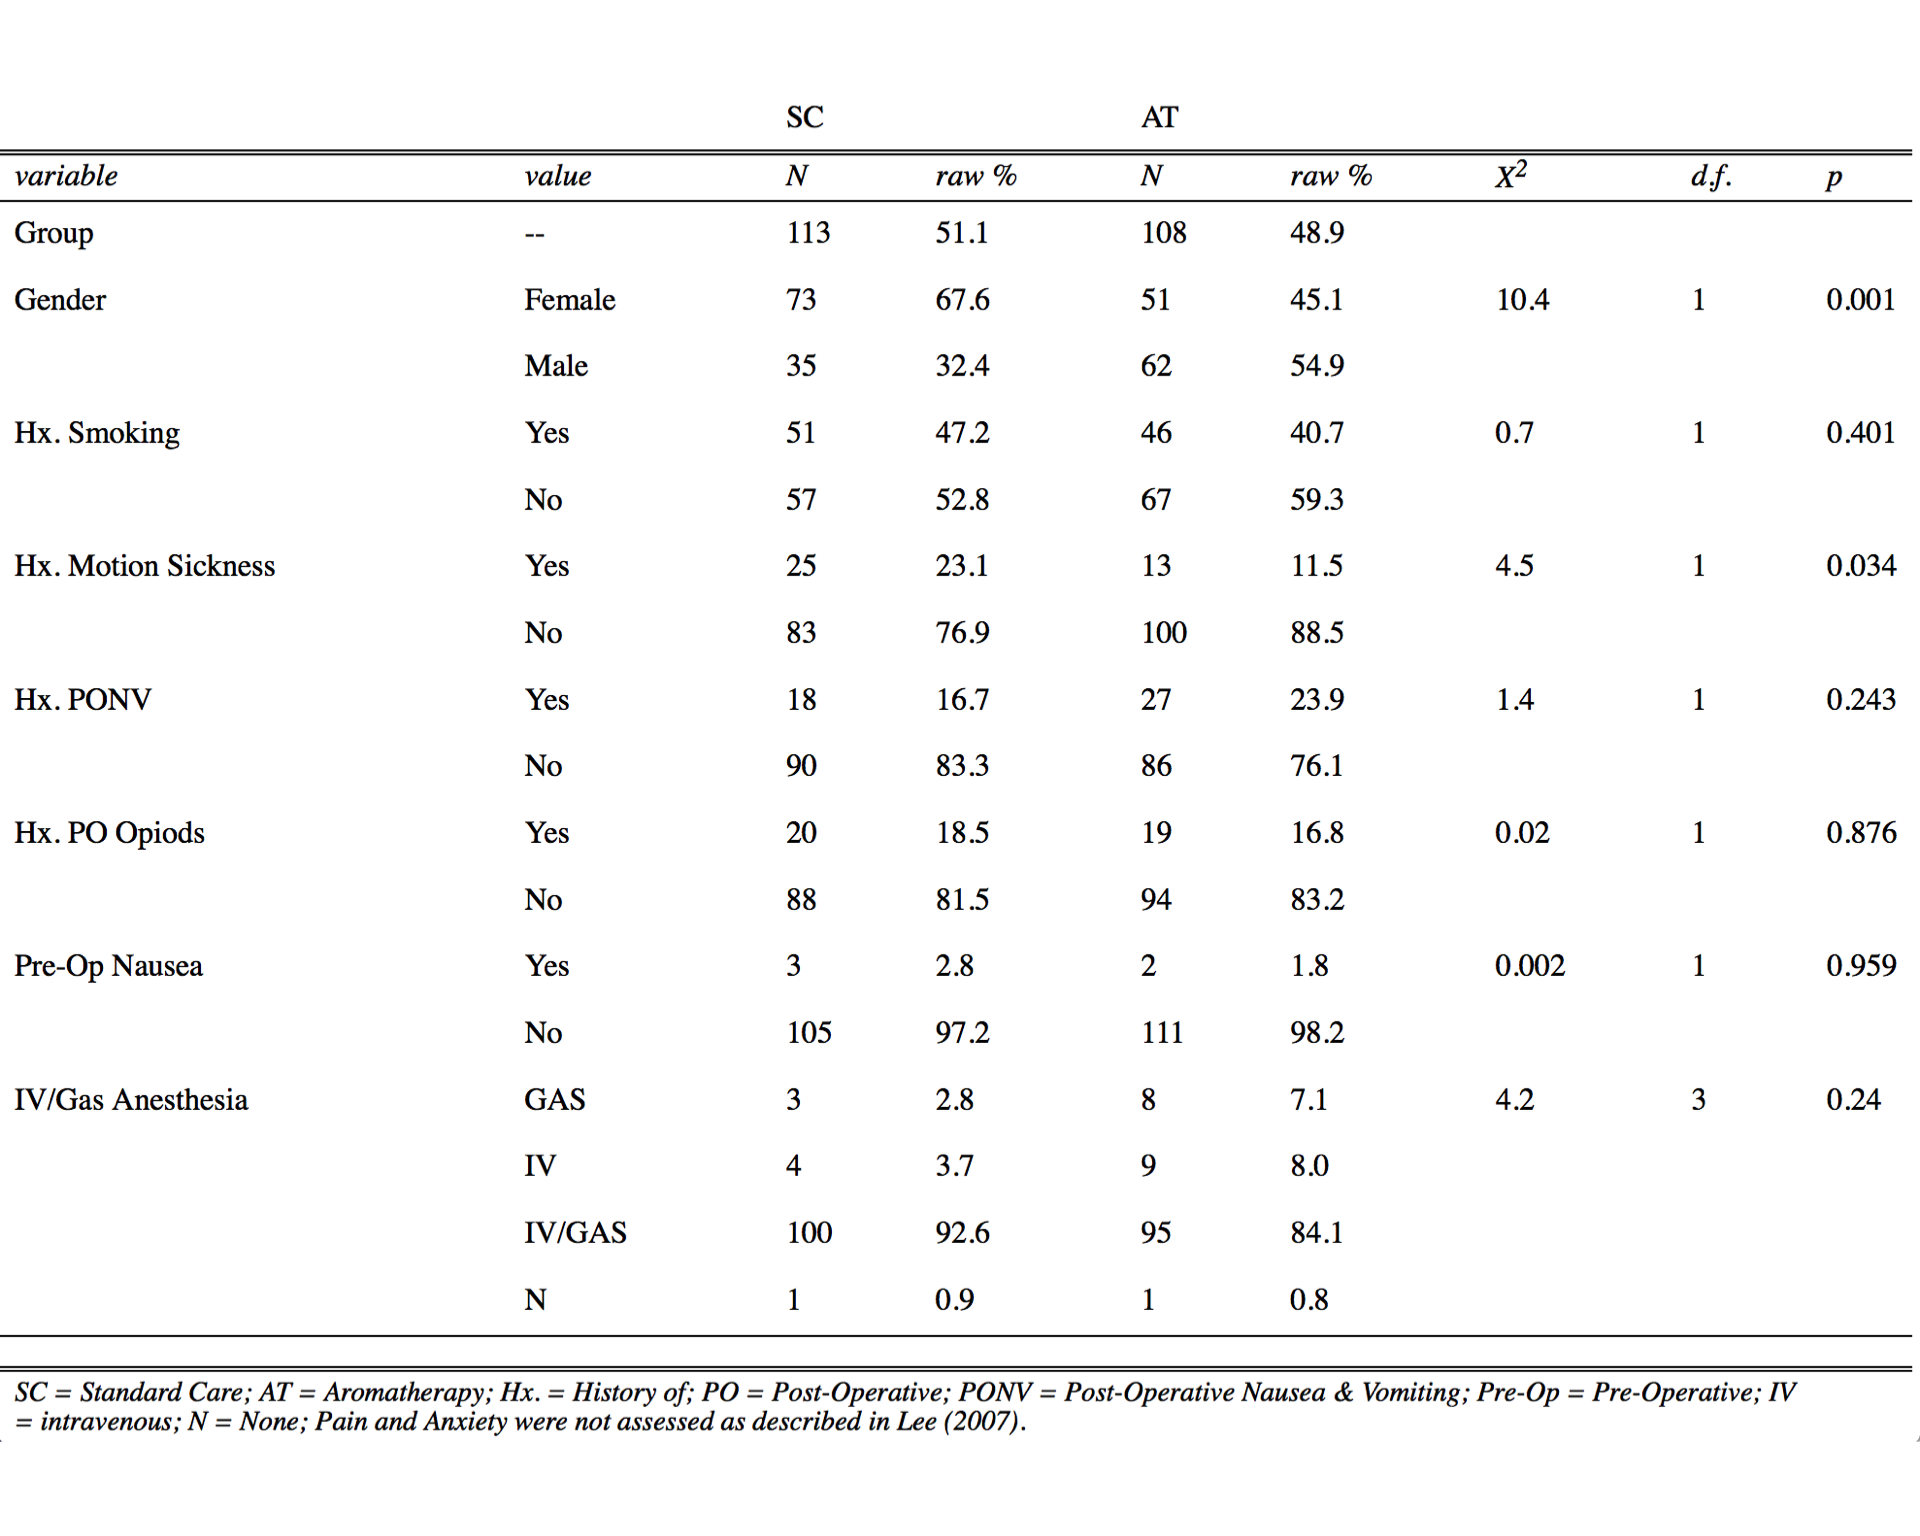 SC, standard care; AT, aromatherapy; raw %, percentage of value represented within a variable and group; Hx., history of; PONV, postoperative nausea and vomiting; PO, postoperative; preop, preoperative; IV, intravenous; N, none.Pain and anxiety were not assessed as described in Lee et al.29 Pearson’s chi-square ( \(\chi^2\) ) test with Yates’ Continuity Correction, degrees of freedom (d.f.), and P values were determined with R Stats Package.19
Table 2. Patient Demographics (Numerical Data) Comparing Standard Care (SC) and Aromatherapy (AT).
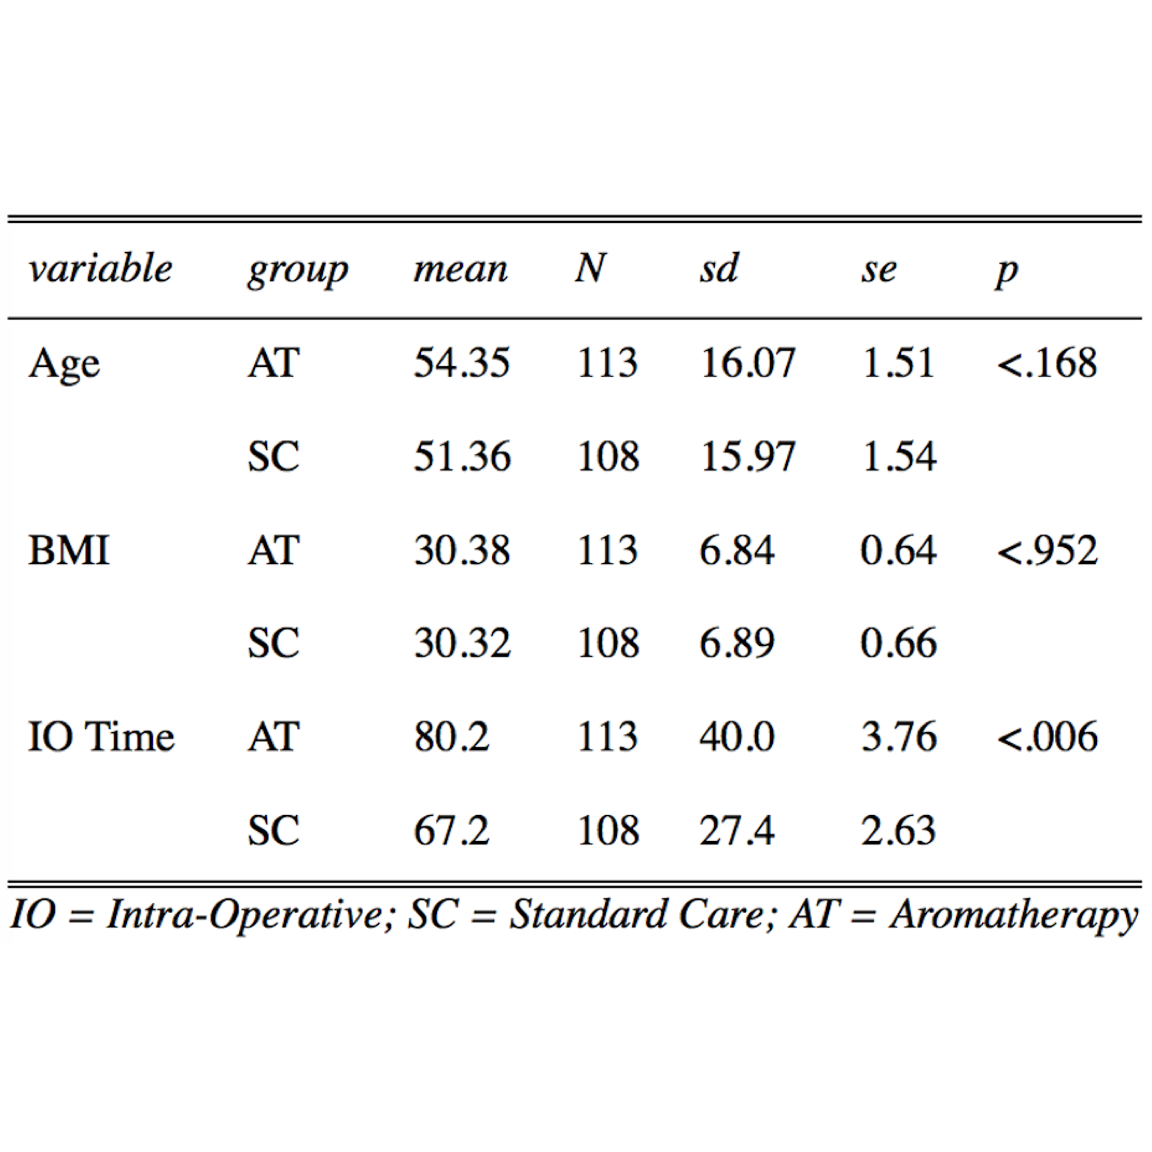 Mean, standard deviation (Sd), standard error (se), and P value (P) were determined by one-way ANOVA with sjPlot Package.21 Intraoperative (IO) time in AT was significantly longer than SC by 13 min.
Distributions of literature-based risk factors assessed in this study (Tables 1 and 2) were gender, histories of smoking, motion sickness, PONV, postoperative opioids, and/or preoperative nausea, age, BMI, and IO time. The SC group demonstrated a statistically significantly higher number of female patients (1.4-fold, \(P = .001\) ) and patients with a history of motion sickness (1.9-fold, \(P = .034\) ), whereas the AT group demonstrated an increase in IO times (2.1-fold, \(P \le .006\) ). Surgeries were categorized by general, ortho/neuro, urinary, head/neck, vascular, and other (Table 3). General and ortho/neuro procedures comprised the majority of surgeries (74% in SC and 72% in AT). However, no significant differences were determined between study groups or between patients with and without PONV (data not shown). The total average length of stay was 94.3 and 49.9 minutes in the PACU and SDCC, respectively, with a total average postoperative length of stay of 114 minutes (2.4 hours).
Table 3. Distribution of Surgeries Comparing Standard Care (SC) to the Aromatherapy (AT) Study Group.
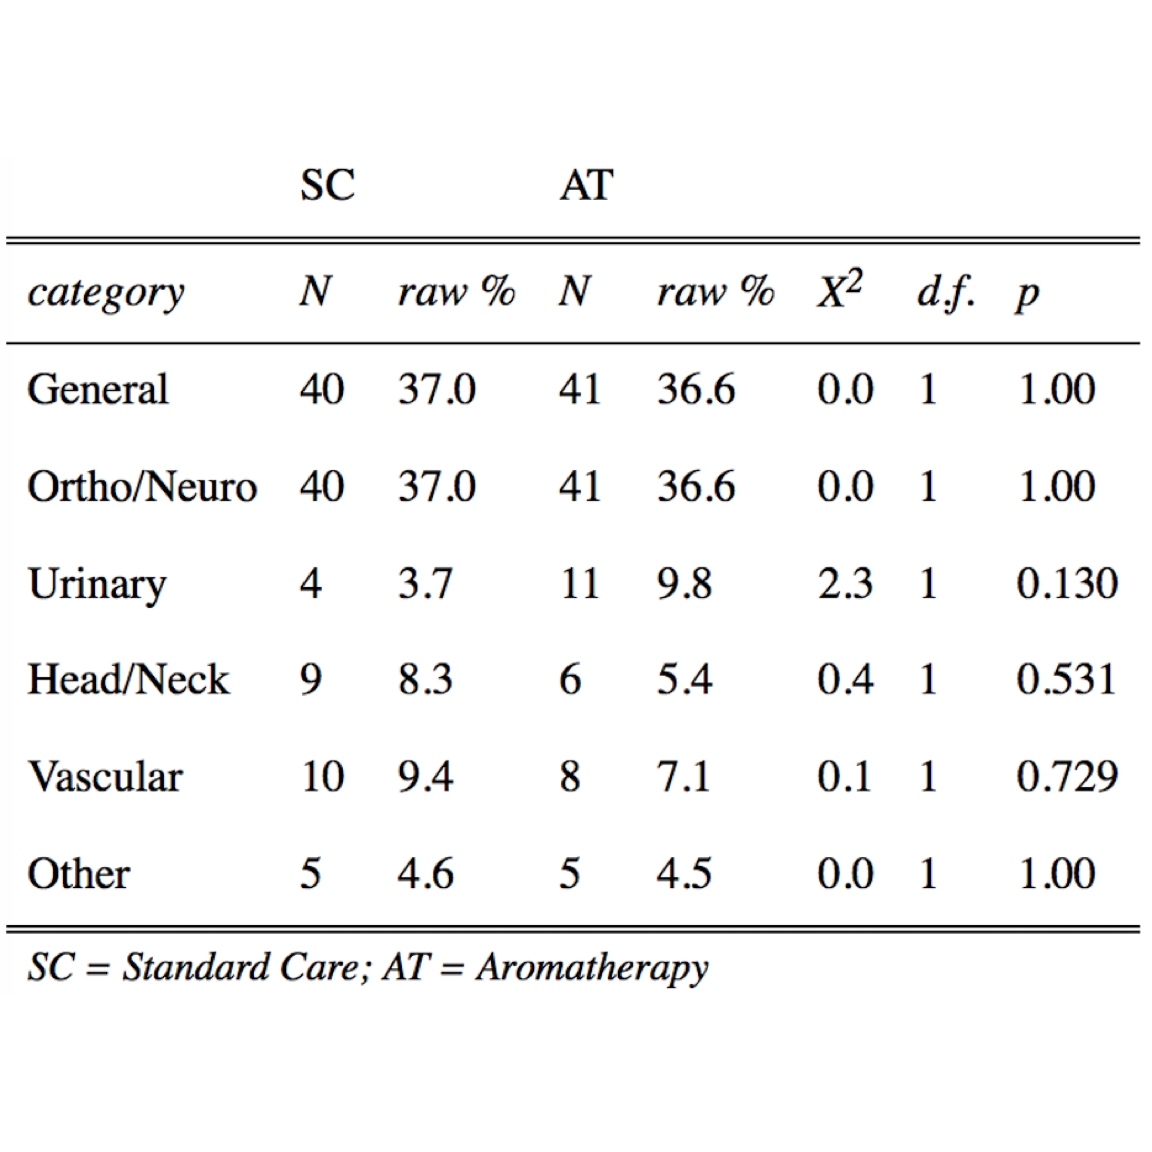 N, number; raw %, percentage of value represented within a variable and group. Pearson’s chi-square ( \(\chi^2\) ) test with Yates’ Continuity Correction, degrees of freedom (d.f.), and P values were determined with R Base Package.19
PONV: Effectiveness of AT Compared With SC
Of patients (64 of 221) that experienced PONV, 52% were in the AT group and 48% in the SC group. No significant difference in the distribution of PONV was determined between SC and AT (Figure 2). When patients were asked to assess their level of satisfaction in either SC or AT, most patients (69% to 70%) strongly agreed that treatment was both timely and effective (Figure 3); however, no significant differences were determined between groups (timely, \(P = .60\); effective, \(P = .86\) ).
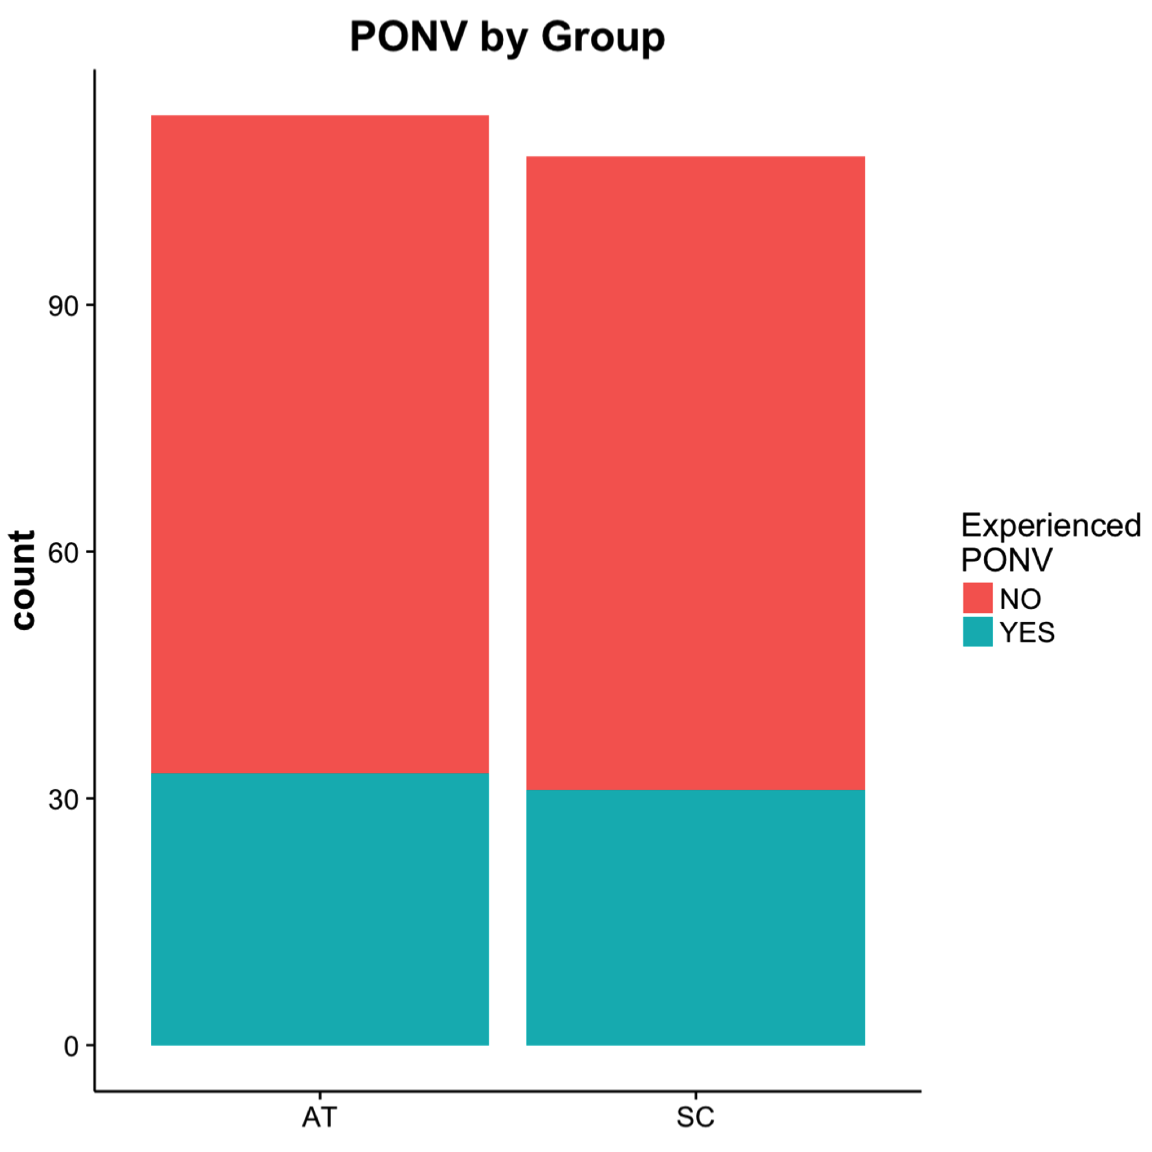
Figure 2. The total number of postoperative patients that experienced PONV was 64 (29%) of 221. The number of patients with postoperative nausea and vomiting (PONV) by group were 33 (52%) in the aromatherapy (AT) and 31 (48%) in the standard care (SC).
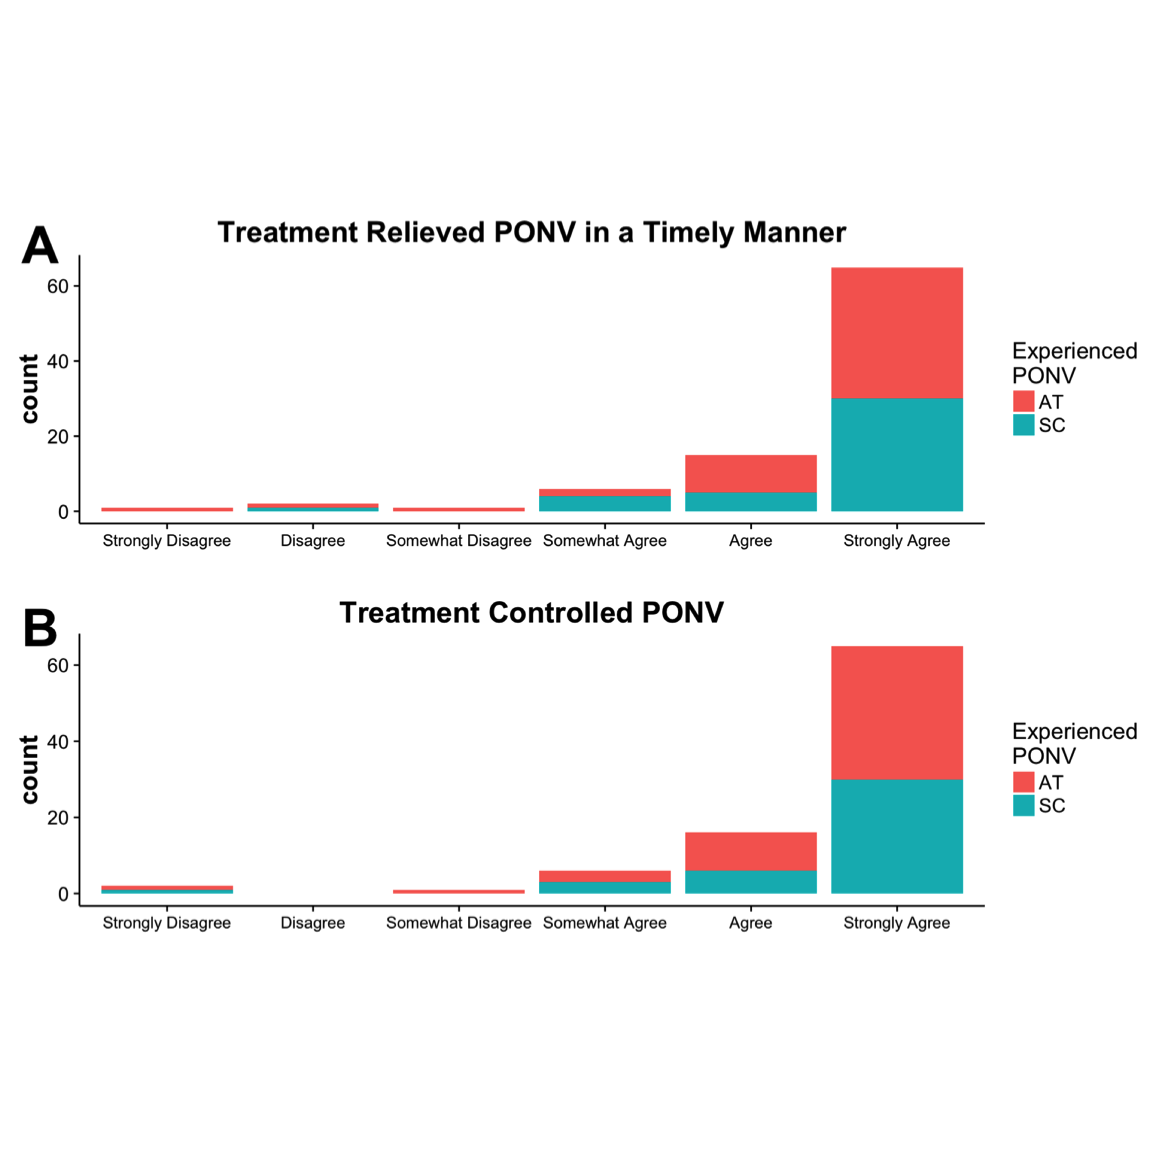
Figure 3. Patient responses to study questions on a six-point Likert scale, 0-5: (A) “The treatment Iwas given relieved my nausea in a timely manner,” and (B) “The treatment I received controlledmy nausea.” Note: no patients responded with “Disagree.” AT, aromatherapy; SC, standard care.
Improvement in severity of PONV and postoperative doses of analgesics and antiemetics were determined and evaluated (Figure 4). In patients with PONV, improvement in severity of nausea and vomiting was reassessed, pretreatment and post-treatment, and with each episode of nausea up to five times during their stay on the unit.
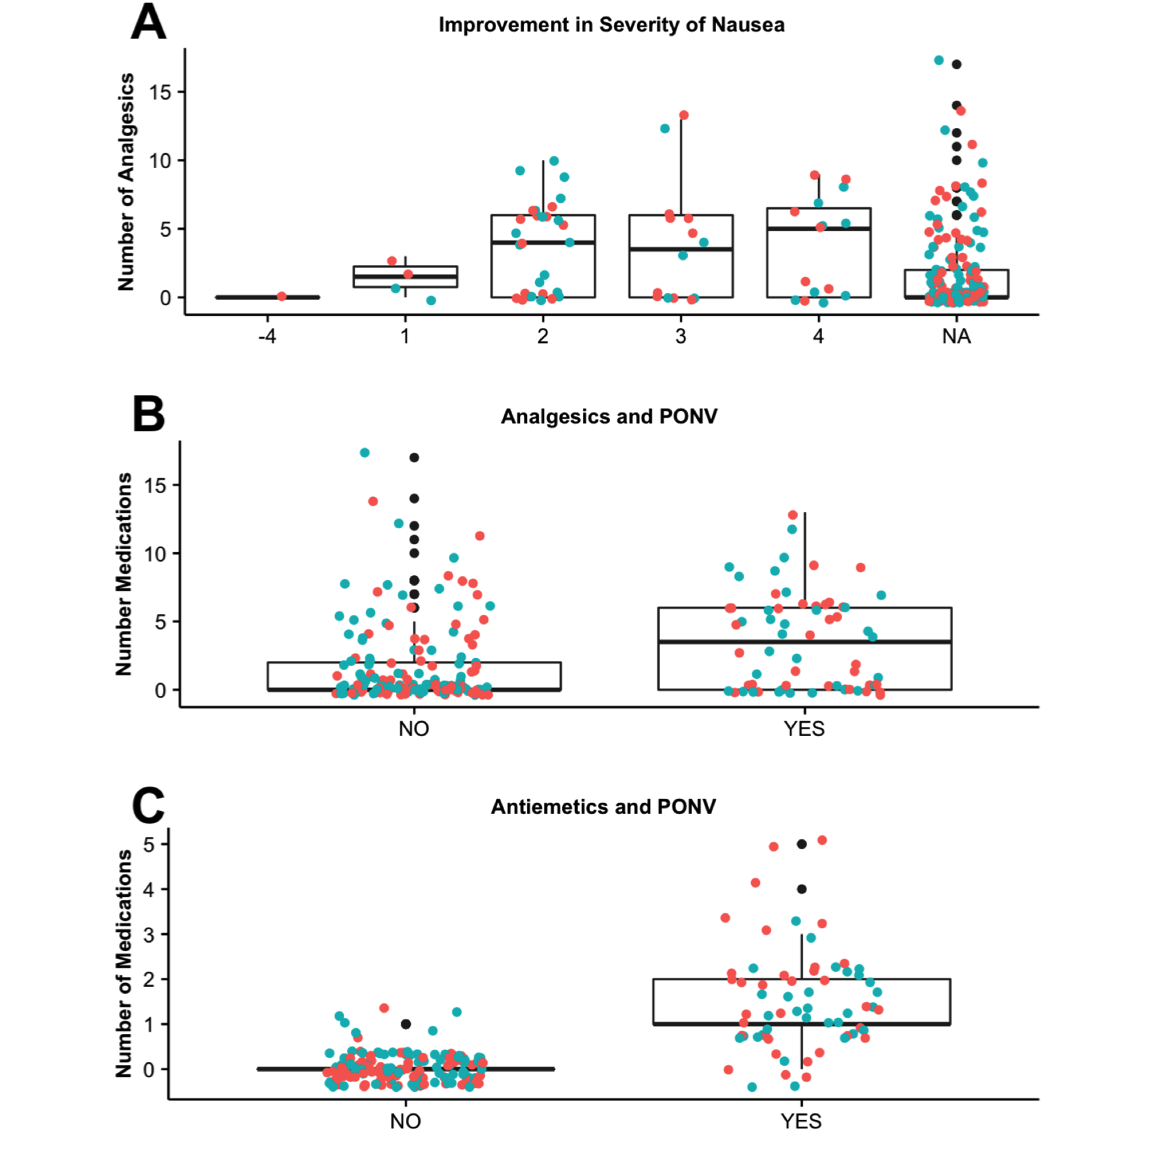
Figure 4. (A) Improvement in PONV by study group AT (red) and SC (blue). The change in nausea was determined (eg, patient #1 entered PACU with a level of 4 nausea, and at the third assessment, patient #1 had a level of 1 nausea, resulting in an improvement of 3 in severity). The number of analgesic doses (B) and (C) antiemetics doses administered in patients that reported NV (YES) or did not report nausea (NO) was also determined. PONV, postoperative nausea and vomiting; AT, aromatherapy; SC, standard care; PACU, postanesthesia care unit.
The total change in PONV severity was determined. For example, if a patient entered PACU with a level of 4 PONV, and by the third and final assessment, the patient reported a level of 1, this resulted in an improvement of 3 in severity. There was no significant difference in the change in severity when comparing AT to SC (Figure 4A). The number of medication doses ranged from 0 to 18 in patients with no PONV; however, those that presented with PONV were given fewer doses, between 0 and 11 doses (median scores ~1 to 4) with no correlation to severity ( \(P=.73\) ). The number of analgesics and antiemetics administered to patients (Figure 4B-C) that reported PONV (YES) were significantly higher ( \(P < .001\) and \(P < .001\), respectively).
Evaluation of Risk Factors and Their Predictive Value
In a recent study, nine factors were identified as predictive for PONV in patients using patient- controlled analgesia.29 However, many of these factors and their actual value in predicting PONV are still under debate.29 To determine whether known (and unknown) risk factors were predictive of PONV in our study, we evaluated several different models using the caret package.25 The caret package consolidates and implements many different types of algorithms in a simplistic and unified language.
We tested the C5.0 model as described in Lee et al,29 and seven other models: ctree, cforest, gbm, nnet, pls, rf, and rpart. These are a few of the potential models that handle mixed data well (ie, binary factors [gender (M/F), histories of PONV, motion sickness, smoking, preoperative nausea, and postoperative opioids (YES/NO)], continuous [Age, BMI, IO Time], and integers [anesthesia (GAS, IV, IV/GAS, or N)]). In addition, we evaluated whether other preoperative and IO predictors, such as the use of antiemetics, analgesics, and reversal agents, improved the predictive power of each model.
As often said in modeling, “there is no free lunch,” and therefore we had to tune, repeatedly test, and evaluate what model worked the best with our data set (Figure 1: workflow). Initially, we evaluated all predictors and found that preoperative nausea and type of anesthesia demonstrated essentially no variance and were removed from the data set, as recommend by Therneau et al.30 We randomly partitioned the data set into a 65% training set ( \(n = 145\) ) and 35% testing set ( \(n = 76\) ). The training sets were resampled in bootstrap (25 times), cross-validation (10 times), or repeated cross-validation manner (30 times) up to 15 times to tune the parameters for each model using the “train” function within the caret package.19 Once each model was trained on the testing set, the “predict” function was used to test the final model (best tuned, up to five parameters), based on the analysis of repeated ROC results for each resampling method previously (Figure 5). The AUC was determined for each prediction five times, all of which were reported in Figures 6 and 7.
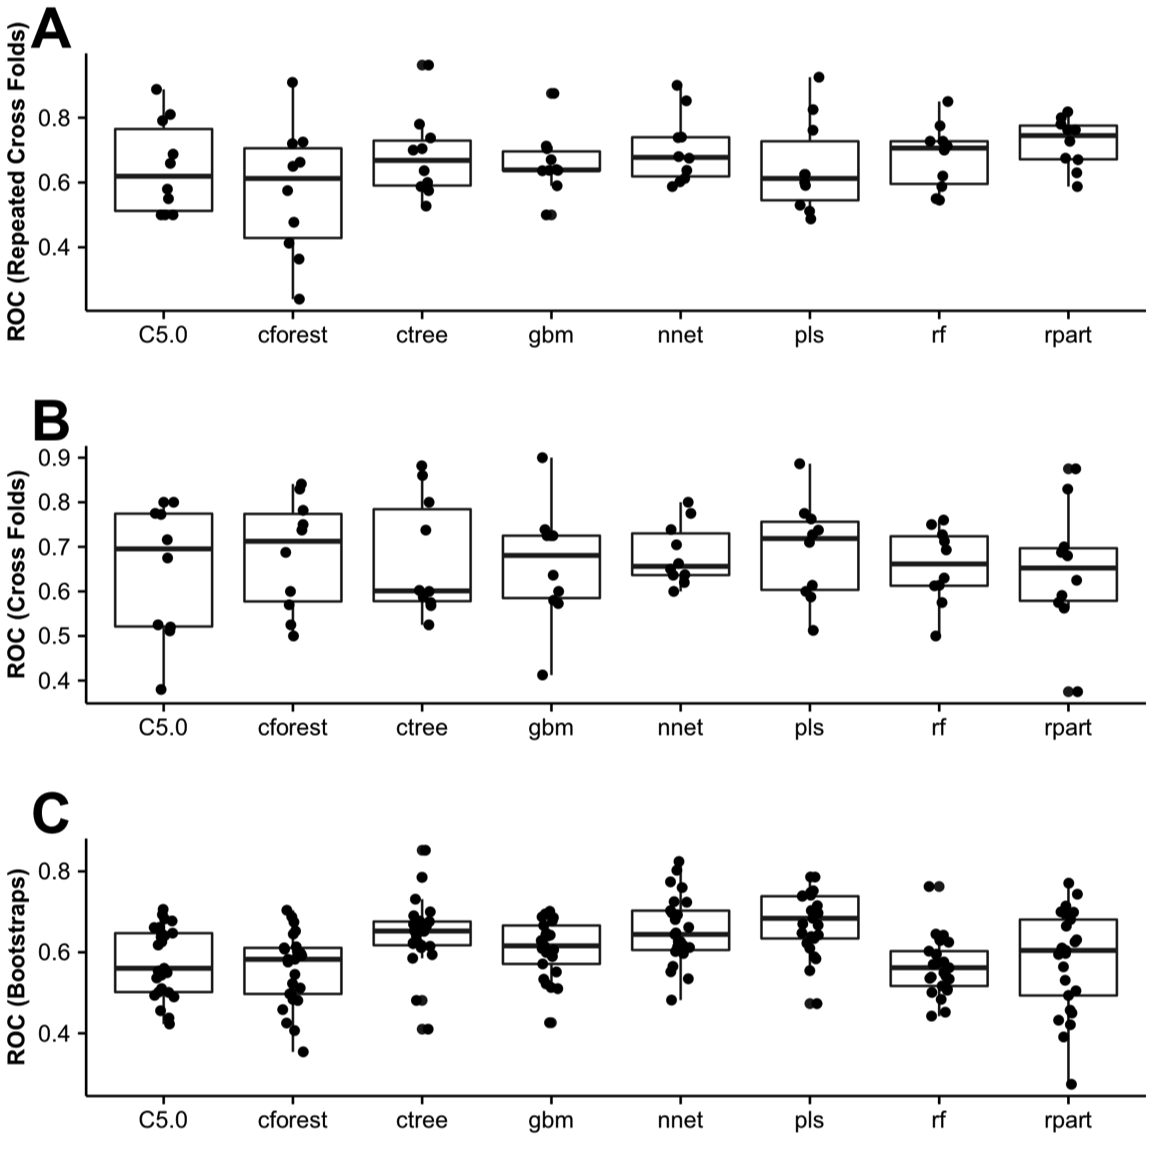
Figure 5. Receiver operator curve (ROC). Sixty-five percent of the data set (training set) was randomly partitioned and resampled by (A) repeated cross-folds, (B) cross-folds, or (C) Bootstrap methods provided by caret.
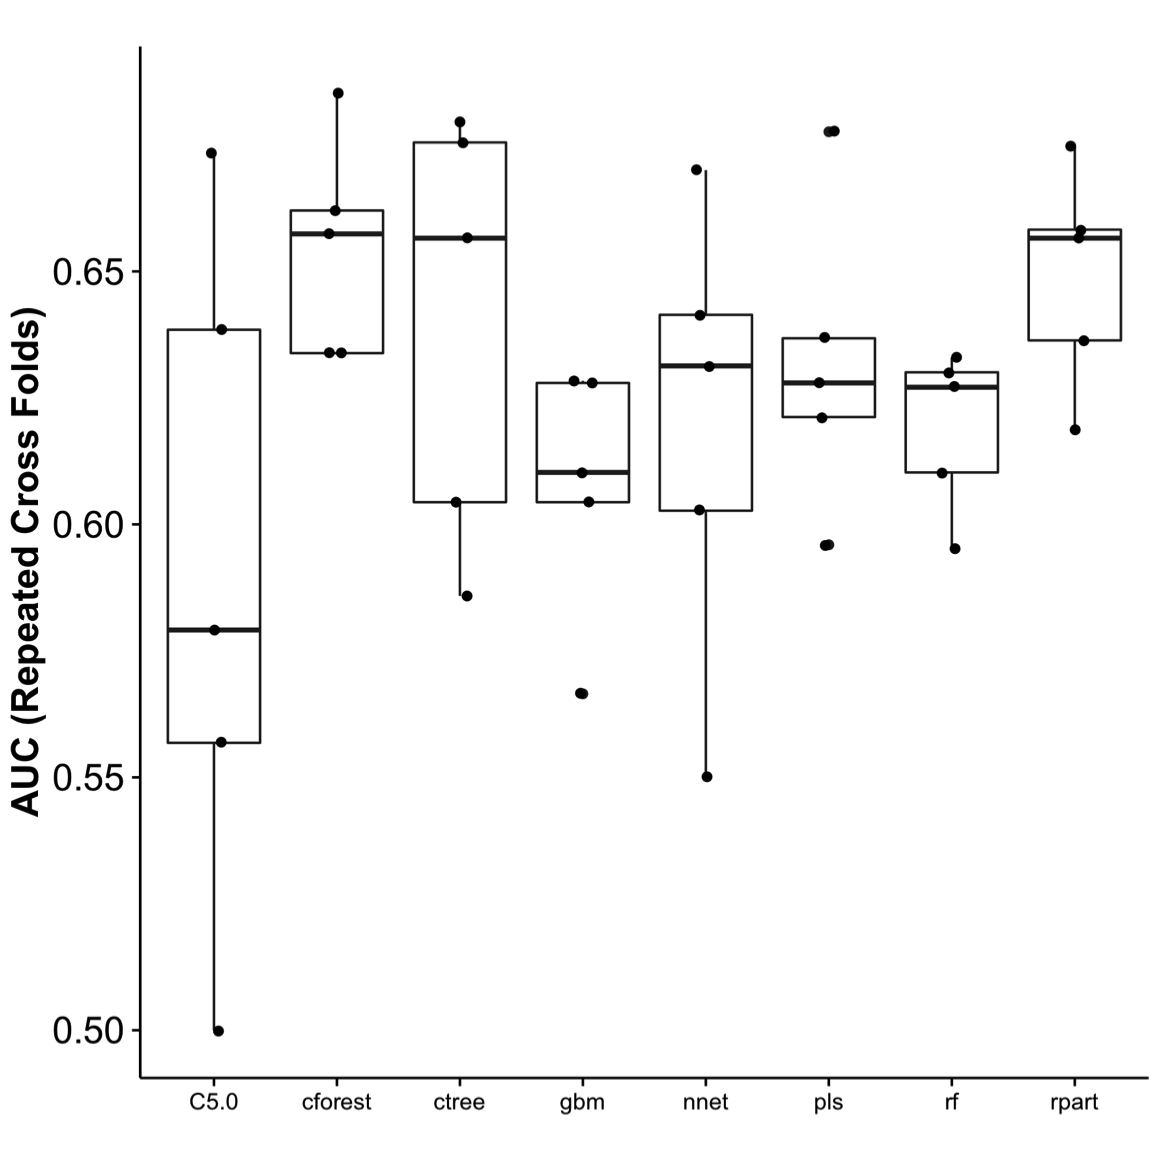
Figure 6. Area under the curve (AUC). Using the cross-folds resampling method to train and tune the model, it was then used to test the remaining 35% of the data set (testing set). AUC was used to assess the best performance. The testing was repeated five times, and performance show in the chart. Cforest performed the best, with the least variance. ROC, receiver operator curve.
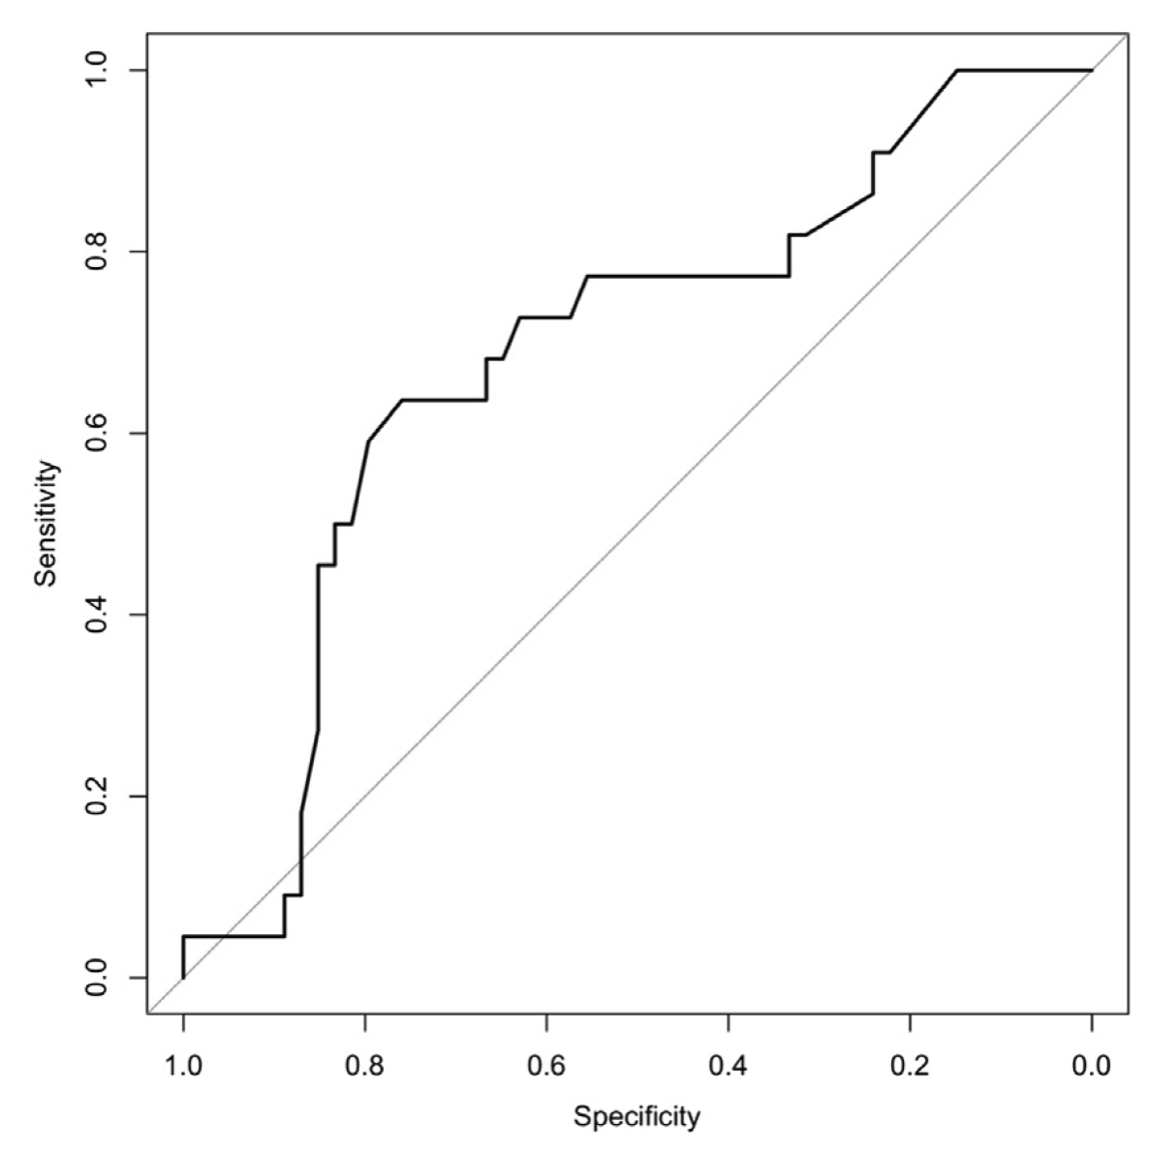
Figure 7. Area under the curve (AUC) for the cforest model. Based on our data set, literature-based factors provided modest predictive value using the cforest method (AUC ~ 0.69).
A total of seven predictors (gender, age [binary \(\ge 50\) years or \(< 50\)], nonsmoker, history of PONVor motion sickness [ponv_ms],31 BMI [binary \(>25\) or \(\le 25\)], and IO time [io_time, binary \(\ge 60\) min or \(<60\)]) were used to develop a predictive model and evaluate the relative importance of predictors (Figure 8). Since 79.7% of non-PONV and 74.5% of PONV patients had \(>25\) BMI, it was of little importance as a predictive power. On the other hand, 75% of PONV patients were female compared with 48.4% in patients without PONV, resulting in the most important predictive factor. Random forests (ie, cforest) are a type of recursive partitioning method particularly well suited to small sample size and large P-value problems. While the cforest greatly boosts the performance of the final model, it comes at the expense of some loss of interpretability (ie, no decision tree). Overall, our results demonstrate that gender, age, and histories of smoking and motion sickness/PONV were the most important predictive factors of PONV. PDNV: Effectiveness of AT Compared With SC Of patients who experienced PONV (64 of 221), 75% were contacted postdischarge: 23 (36%) in the AT group and 25 (39%) in the SC group.
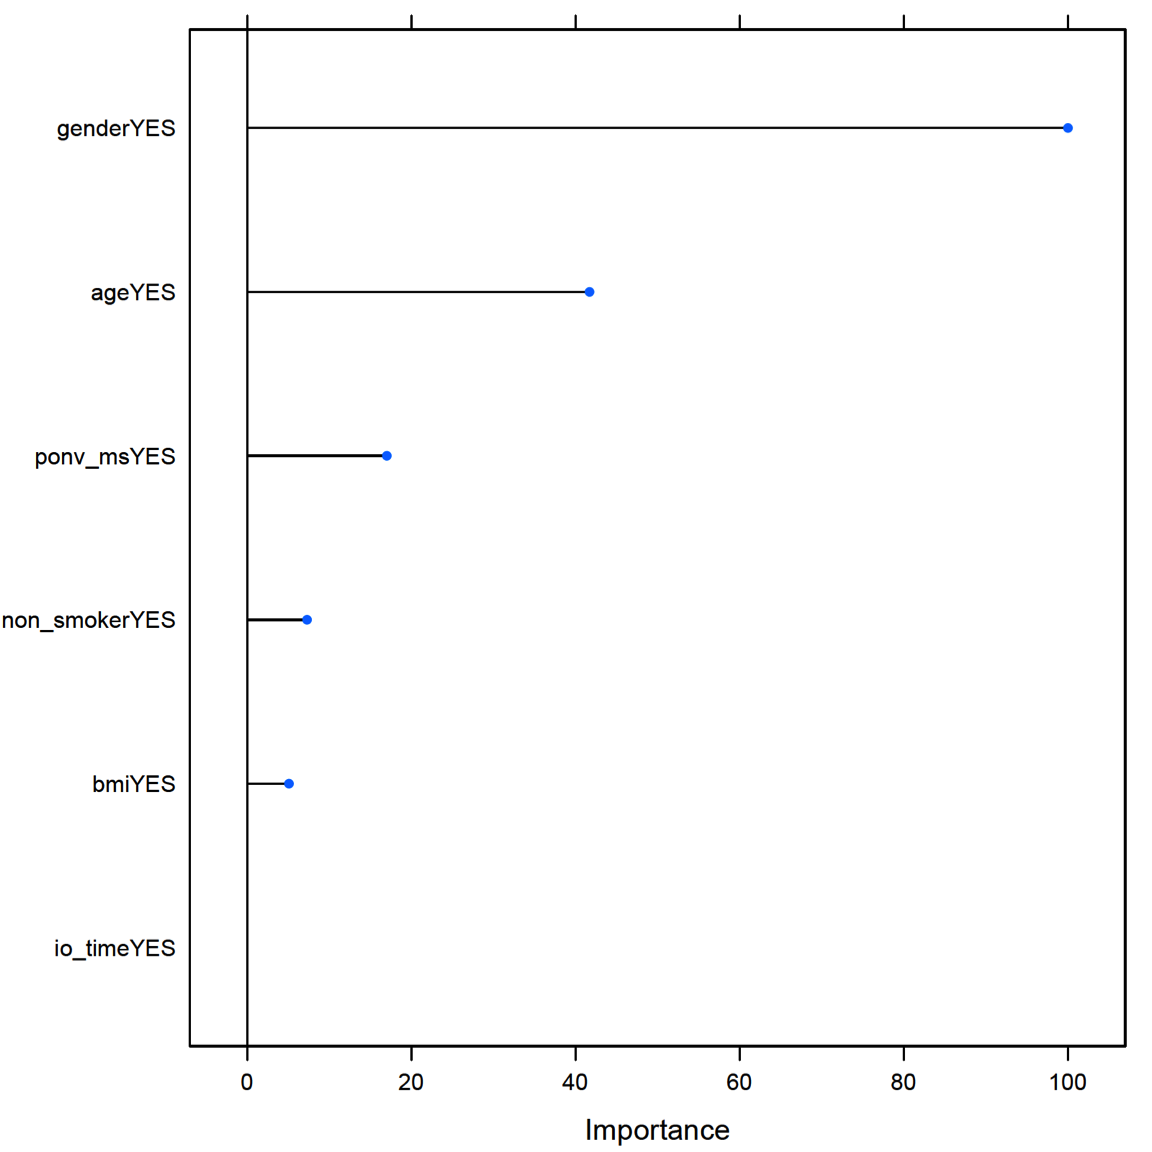
Figure 8. Relative variable importance of factors in PONV. Of the literature-based factors, gender provided the most predictive power. PONV, postoperative nausea and vomiting.
Sixteen (25%) were excluded due to no answer after three attempts, or patient not accessible. Of the 48 (75%) patients interviewed, 11 (23%) experienced PDNV: 5 in the AT group and 6 in the SC group. All (100%) patients with PDNV in the AT group indicated that the AT was effective in relieving their nausea. Of patients in the SC group, 67% indicated effectiveness in management of PDNV with soda, acetaminophen, antacids, crackers, and/or by lying quietly without moving. Anecdotal comments from the SC group indicated that effectiveness of treatment was prolonged.
Discussion
The ASPAN guidelines for management of PONV/PDNV recommended that higher quality research be implemented to determine the effect that various complementary modalities may have on reducing PONV. Here, we conducted a prospective randomized study that compared the effectiveness of AT to SC for relief of PONV/PDNV. In agreement with previously published work, our patient population data showed limited evidence that AT reduces PONV. Although AT is associated with high patient satisfaction,10 in our study, there was no significant difference between patient satisfaction scores when compared with SC.
We also found that known literature-based risk factors provided similar predictive power for patients who were at risk for PONV. In regards to PDNV, as with another study,32 our sample size was too small, a limitation of the study; yet, all patients in the AT group found AT to be effective.
A systematic literature review3 identified that the most reliable independent predictors of PONV were female gender (odds ratio: 2.57, 95% confidence interval: 2.32 to 2.84) and history of PONV or motion sickness (2.09, 1.90 to 2.29). In our study, patients of female gender and those with a history of motion sickness were statistically significantly higher in the SC group (\(P=.001\) and \(P=.034\), respectively). Thus, we believe that this imbalance in the number of patients was a limitation of the study. Furthermore, a potential limitation of this study was the use of a nonvalidated nausea scale, originated from responses PONV patients commonly verbalized to nurses on a daily basis. However, our scale is similar to other published scales.
In this study, we demonstrated how the use of machine learning workflow (Figure 1) can benefit clinicians in identifying a patient at risk for PONV. Critical components in perianesthesia nursing practice include the assessment of patients at risk for PONV/PDNV, and the communication of risks to all providers within the perianesthesia setting in an effort to tailor treatment to the patient’s respective profile and preference.12 For this reason, it is important to determine the probability that a patient may experience PONV. To determine whether literature-based risk factors in our study were predictive, all data were repetitively processed, variables with no variance were removed, and risk factors were evaluated using the caret package to identify best performance. Similar to Lee et al,29 we used the C5.0 model, but found it to perform poorly compared with other decision tree and recursive partitioning methods. With our limited data set, cforest performed the best with our replicate achieving 69% (Figures 5-7), a level of performance found in similar studies.31
Conclusion
While this study found no significant difference in comparing the effectiveness of AT to SC for relief of PONV/PDNV, our model for predicting literature-based risk factors exhibited a 0.69 AUC. For practical and clinical purposes, the ability to identify patients at risk for PONV with a 69% certainty, confidently equips the perianesthesia nurse to communicate risks to the perioperative team and initiate interventions, inclusive of AT, that provide a holistic comfort approach. Comfort is a state of relief from noxious stimuli.16 Thus, planning measures to avoid PONV provides both physical and psychological comfort. Screening tools within the clinical setting are needed to enable nurses to identify patients at risk for PONV/PDNV. Research with large sample sizes is needed to evaluate patients at risk for PONV and PDNV and to determine the efficacy of AT as a nonpharmaceutical option for perianesthesia nurses in treating patients.
Acknowledgments
The authors thank all nursing, management and support staff within the perioperative environment that helped inform, enroll, and care for patients taking part in the AT study. A special thanks to Mike Aders and Linda Blankenberger who went above and beyond in planning and data collection, and to Margi Scott, a Deaconess Hospital Volunteer and retired nurse, who assembled and stocked the study folders. The Research Team, SDCC, and PACU staffs thank Soothing Scents for providing the aromatherapy product, QueaseEase, and the educational booklets for the study. Last, but not least, the authors are deeply indebted for the invaluable work and time provided by the Deaconess Librarian, Gail Lee, MLS. Author contributions: The conception, design development, and initiation of this study involved L. M. Stallings-Welden, M. Doerner, E. (L.) Ketchem, L. Benkert, S. Alka, and J. D. Stallings with coordination of the research by L. M. Stallings-Welden. The original clinical question was derived by S. Alka and became the catalyst for the research study. Study participant de-identification was done by L. M. Stallings-Welden. Literature research was conducted by L. M. Stallings-Welden, M. Doerner, E. (L.) Ketchem, and L. Benkert. Chart review, data collection, and data entry were accomplished by L. M. Stallings-Welden, E. (L.) Ketchem, L. Benkert, and S. Alka. Staff education materials were the responsibility of L. Benkert. The manuscript was written by L. M. Stallings-Welden, and the theoretical framework was completed by M. Doerner with revisions from all authors. The statistical analysis was conducted by J. D. Stallings inclusive of all aspects of data analysis, figure generation, machine learning, manuscript writing, and editing. All authors read, conducted final review, and approved the final manuscript submission. Funding: No financial funding received. Aromatherapy product donated by Soothing Scents. Reproduction of colour artwork costs provided by the Deaconess School of Nursing Alumni.
References
1. Raeder J. History of postoperative nausea and vomiting. International Anesthesiology Clinics. 2003;41(4). http://journals.lww.com/anesthesiaclinics/Fulltext/2003/41040/History_of_Postoperative_Nausea_and_Vomiting.3.aspx.
2. Gan TJ. Postoperative nausea and vomiting—can it be eliminated? JAMA. 2002;287(10):1233-1236. doi:10.1001/jama.287.10.1233
3. Apfel CC, Philip BK, Cakmakkaya OS, et al. Who is at risk for postdischarge nausea and vomiting after ambulatory surgery? Anesthesiology. 2012;117(3):475-486. doi:10.1097/ALN.0b013e318267ef31
4. Apfel CC, Korttila K, Abdalla M, et al. A factorial trial of six interventions for the prevention of postoperative nausea and vomiting. N Engl J Med. 2004;350(24):2441-2451. doi:10.1056/NEJMoa032196
5. Obrink E, Jildenstal P, Oddby E, Jakobsson JG. Post-operative nausea and vomiting: Update on predicting the probability and ways to minimize its occurrence, with focus on ambulatory surgery. Int J Surg. 2015;15:100-106. doi:10.1016/j.ijsu.2015.01.024
6. Gan TJ, Sloan F, L Dear G de, El-Moalem HE, Lubarsky DA. How much are patients willing to pay to avoid postoperative nausea and vomiting? Anesthesia & Analgesia. 2001;92(2). http://journals.lww.com/anesthesia-analgesia/Fulltext/2001/02000/How_Much_Are_Patients_Willing_to_Pay_to_Avoid.22.aspx.
7. Dzwonczyk R, Weaver T, Puente E, Bergese S. Postoperative nausea and vomiting prophylaxis from an economic point of view. American Journal of Therapeutics. 2012;19(1):11-15.
8. Gupta D, Haber H. Gupta d, haber h. Emetogenicity-Risk Procedures in same day surgery center of an Academic University Hospital in United States: A retrospective cost-audit of postoperative nausea vomiting management. 2014;22(5):493-502.
9. American Society of PeriAnesthesia Nurses PPSWT. ASPAN’S evidence-based clinical practice guideline for the prevention and/or management of ponv/pdnv. J Perianesth Nurs. 2006;21(4):230-250. doi:10.1016/j.jopan.2006.06.003
10. Hines S, Steels E, Chang A, Gibbons K. Aromatherapy for treatment of postoperative nausea and vomiting. Cochrane Database Syst Rev. 2012;4:CD007598. doi:10.1002/14651858.CD007598.pub2
11. Hodge NS, McCarthy MS, Pierce RM. A prospective randomized study of the effectiveness of aromatherapy for relief of postoperative nausea and vomiting. J Perianesth Nurs. 2014;29(1):5-11. doi:10.1016/j.jopan.2012.12.004
12. Hooper VD. SAMBA consensus guidelines for the management of postoperative nausea and Vomiting: An executive summary for Perianesthesia nurses. Journal of PeriAnesthesia Nursing. 30(5):377-382. doi:10.1016/j.jopan.2015.08.009
13. Kranke P, Apefel CC, Papenfuss T, et al. An increased body mass index is no risk factor for postoperative nausea and vomiting. A systematic review and results of original data. Acta Anaesthesiol Scand. 2001;45(2):160-166. http://www.ncbi.nlm.nih.gov/pubmed/11167160.
14. Choi DH, Ko JS, Ahn HJ, Kim JA. A korean predictive model for postoperative nausea and vomiting. J Korean Med Sci. 20(5):811-815. http://synapse.koreamed.org/DOIx.php?id=10.3346%2Fjkms.2005.20.5.811.
15. Apfel CC, Heidrich FM, Jukar-Rao S, et al. Evidence-based analysis of risk factors for postoperative nausea and vomiting†. BJA: British Journal of Anaesthesia. 2012;109(5):742. doi:10.1093/bja/aes276
16. Kolcaba KY, Kolcaba RJ. An analysis of the concept of comfort. Journal of Advanced Nursing. 1991;16(11):1301-1310. doi:10.1111/j.1365-2648.1991.tb01558.x
17. Wilson L, Kolcaba K. Practical application of comfort theory in the perianesthesia setting. J Perianesth Nurs. 2004;19(3):164-73; quiz 171-173. http://www.ncbi.nlm.nih.gov/pubmed/15195275.
18. Kolcaba K, Wilson L. Comfort care: A framework for perianesthesia nursing. J Perianesth Nurs. 2002;17(2):102-11; quiz 111-113. http://www.ncbi.nlm.nih.gov/pubmed/11925582.
19. Team RC. R: A language and environment for statistical computing. 2015. https://www.R-project.org/.
20. Team R. RStudio: Integrated development environment for r. 2015. http://www.rstudio.com/.
21. Lüdecke D. SjPlot: Data visualization for statistics in social science. 2016. http://CRAN.R-project.org/package=sjPlot.
22. Auguie B. GridExtra: Miscellaneous functions for "grid" graphics. 2016. https://CRAN.R-project.org/package=gridExtra.
23. Wickham H. Ggplot2: Elegant Graphics for Data Analysis. Verlag, New York: Springer; 2009. http://had.co.nz/ggplot2/book.
24. Wilke C. Cowplot: Streamlined plot theme and plot annotations for ’ggplot2’. 2016. https://CRAN.R-project.org/package=cowplot.
25. Jed Wing MKC from, Weston S, Williams A, et al. Caret: Classification and Regression Training.; 2016. https://CRAN.R-project.org/package=caret.
26. Allaire JX J.J.; Cheng. Rmarkdown: Dynamic documents for r. 2016. https://CRAN.R-project.org/package=rmarkdown.
27. Xie Y. Dynamic Documents with R and Knitr. 2nd ed. Boca Raton, FL: Chapman; Hall/CRC; 2015. http://yihui.name/knitr/.
28. Xie Y. Knitr: A comprehensive tool for reproducible research in R. In: Stodden FP V.; Leisch, ed. Implementing Reproducible Computational Research. Boca Raton, FL: Chapman; Hall/CRC; 2014. http://www.crcpress.com/product/isbn/9781466561595.
29. Lee YY, Kim KH, Yom YH. Predictive models for post-operative nausea and vomiting in patients using patient-controlled analgesia. J Int Med Res. 2007;35(4):497-507. http://www.ncbi.nlm.nih.gov/pubmed/17697527.
30. Therneau BR T.; Atkinson. Rpart: Recursive partitioning and regression trees. 2015. https://CRAN.R-project.org/package=rpart.
31. Apfel CC, Kranke P, Eberhart LHJ, Roos A, Roewer N. Comparison of predictive models for postoperative nausea and vomiting. BJA: British Journal of Anaesthesia. 2002;88(2):234. doi:10.1093/bja/88.2.234
32. Mcilvoy L, Richmer L, Kramer D, et al. The efficacy of aromatherapy in the treatment of postdischarge nausea in patients undergoing outpatient abdominal surgery. Journal of PeriAnesthesia Nursing. 30(5):383-388. doi:10.1016/j.jopan.2014.10.004