DailyR ggplot2 Theme Assistant
Dear Friends, I’ve decided to show you ggplot2 Theme Assistant. I’m using a recent blog that can be found here about the scatter plot. The purpose of the Theme Assitant is to provide a RStudio Addin to enable users to make easy adjustments to your gg plot theme. I’m sure you will see the power of the tool in the demo. If you enjoy these type of videos, please like, share, and subscribe! Until next time!
{{ instagram BgSBttIndB0 }}
Major Steps
- Install ggplot2 Theme Assistant to try various pre-set themes
- Use options to turn off scientific notation
- Use geom_point for a simple scatter plot
Create a Scatter Plot - I’m using a recent blog.
library(ggplot2) # load package
library(cowplot)

#remove any other key theme settings!!

data("iris") # load data set
options(scipen=999) # turns off scientific notation

gg <- ggplot(iris, aes(x = Sepal.Length, y = Sepal.Width)) +
  geom_point(aes(col = Species, size = Petal.Length)) +
  xlim(c(min(iris$Sepal.Length), max(iris$Sepal.Length))) +
  ylim(c(min(iris$Sepal.Width), max(iris$Sepal.Width))) +
  labs(subtitle = "Sepal Length vs. Sepal Width",
       y = "Sepal Width",
       x = "Sepal Length",
       title = "Scatterplot",
       caption = "Source: iris dataset")
plot(gg)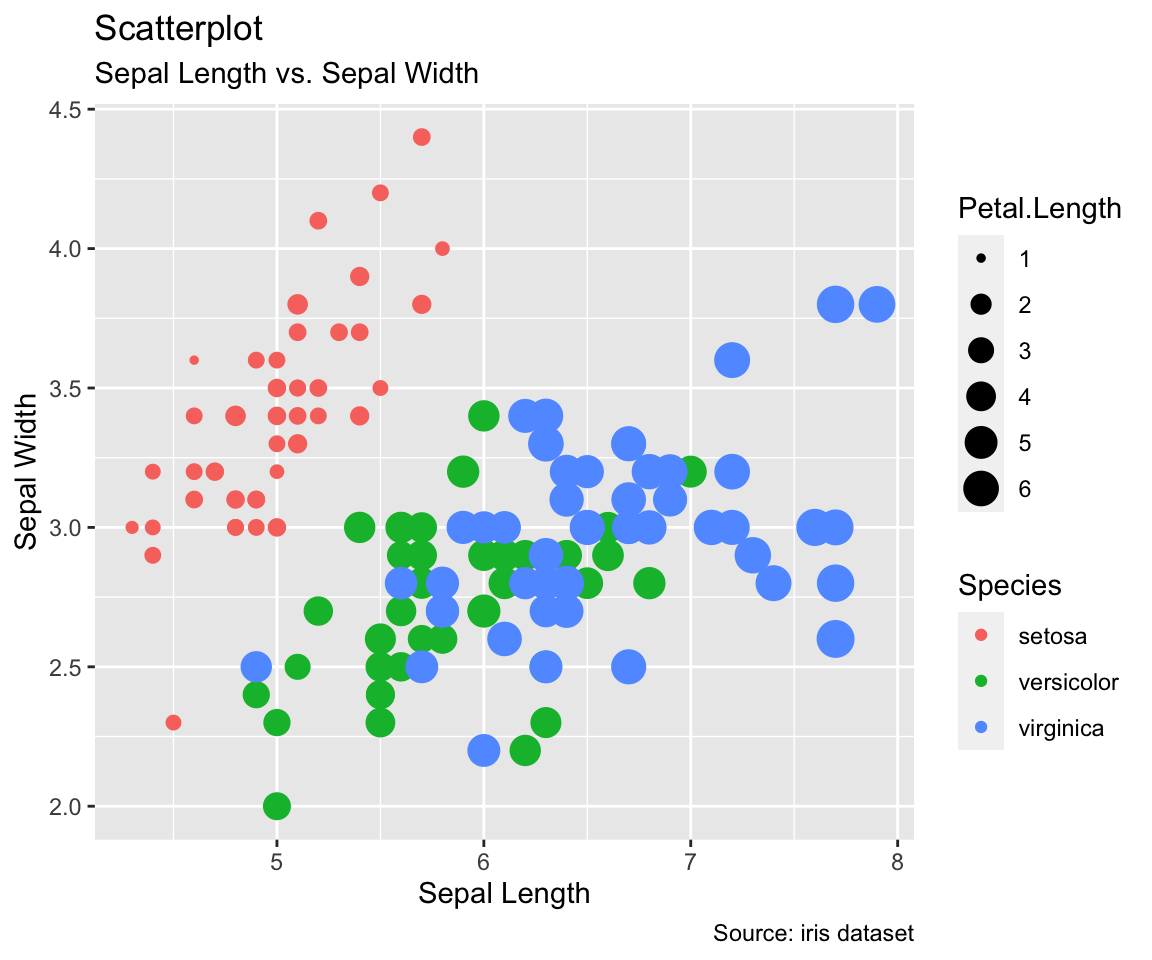
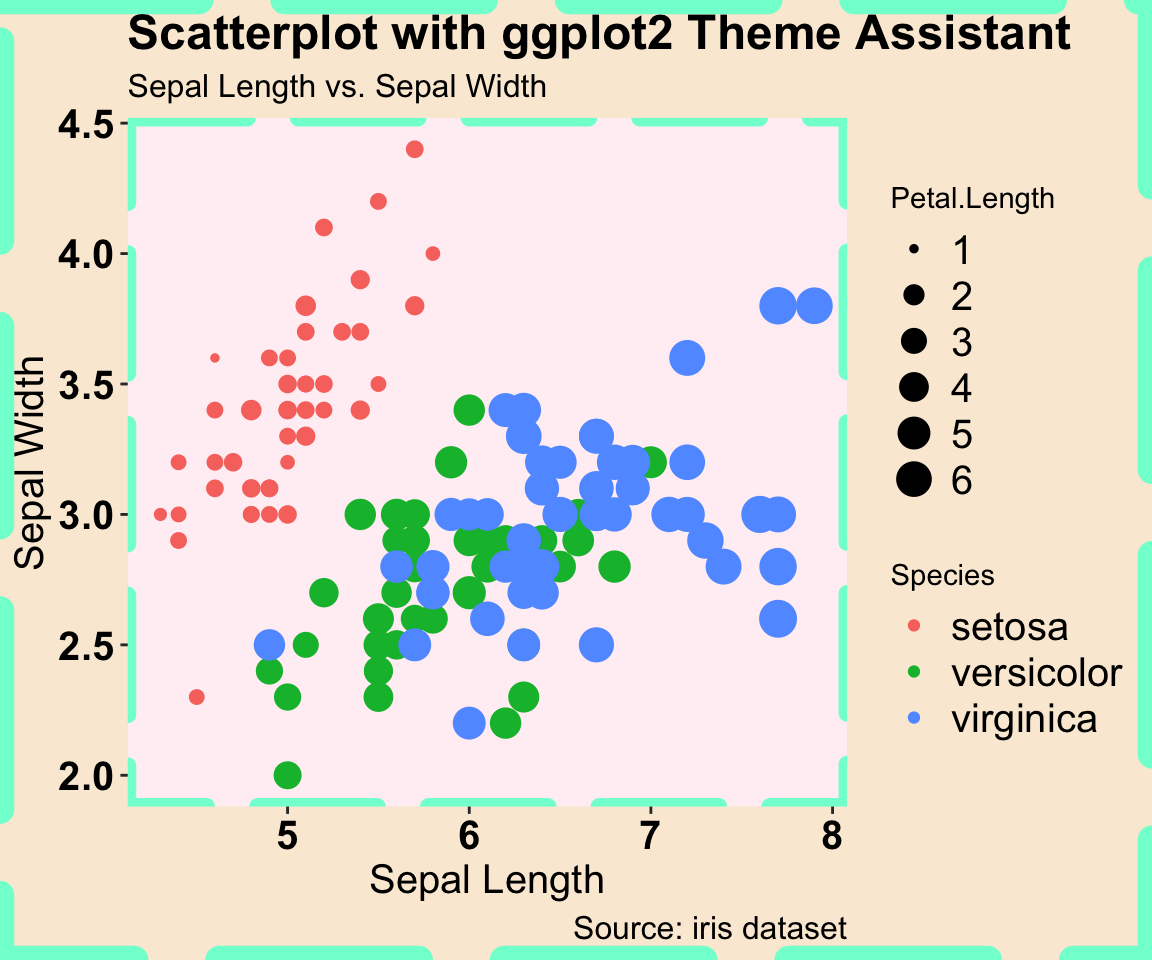
ggPlot Theme Assistant
Select the ggplot code, and then select the Addin feature to adjust the code. It’s pretty nifty!
# install.packages("ggThemeAssist")
# library(ggThemeAssist)

gg <- ggplot(iris, aes(x = Sepal.Length, y = Sepal.Width)) +
  geom_point(aes(col = Species, size = Petal.Length)) +
  xlim(c(min(iris$Sepal.Length), max(iris$Sepal.Length))) +
  ylim(c(min(iris$Sepal.Width), max(iris$Sepal.Width))) +
  labs(subtitle = "Sepal Length vs. Sepal Width",
       y = "Sepal Width",
       x = "Sepal Length",
       title = "Scatterplot",
       caption = "Source: iris dataset") + theme(plot.subtitle = element_text(size = 12,
    vjust = 1), plot.caption = element_text(size = 12,
    vjust = 1), panel.grid.major = element_line(linetype = "blank"),
    panel.grid.minor = element_line(linetype = "blank"),
    axis.title = element_text(size = 15),
    axis.text = element_text(size = 15, face = "bold",
        colour = "black"), axis.text.x = element_text(colour = "black"),
    plot.title = element_text(size = 18,
        face = "bold"), legend.text = element_text(size = 15),
    panel.background = element_rect(fill = "lavenderblush1",
        colour = "aquamarine", size = 3,
        linetype = "longdash"), plot.background = element_rect(fill = "antiquewhite",
        colour = "aquamarine1", size = 5,
        linetype = "longdash"), legend.key = element_rect(fill = NA),
    legend.background = element_rect(fill = NA)) +labs(title = "Scatterplot with ggplot2 Theme Assistant")
plot(gg)